Building vessel trajectories with noisy and missing data
PostGIS has a nifty geometry type called a “trajectory”. This is “a linear geometry with increasing measures (M value) on each coordinate”; basically a line with (x,y,t) coordinates. Trajectories have some nice functions available which make them good for using them to match to other datasets. They could be used to calculate the distance between locations from different datasets over time; finding out whether GPS enabled birds are following fishing vessels around or whether remote sensing detections can be matched to vessel tracks.
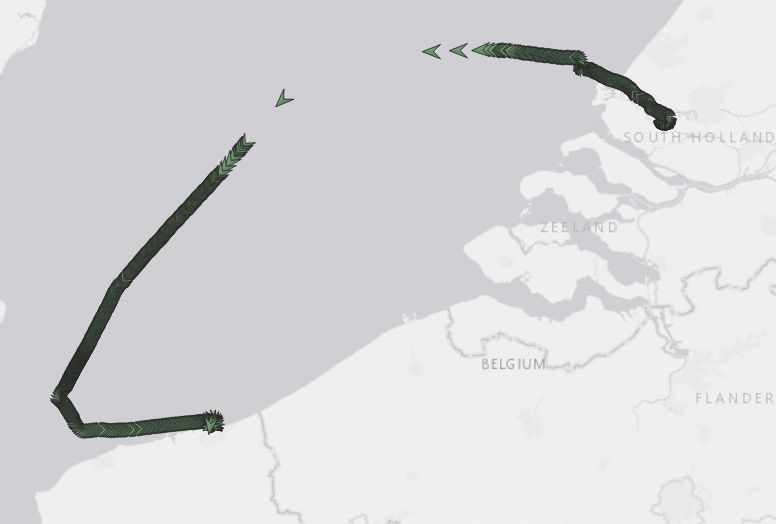
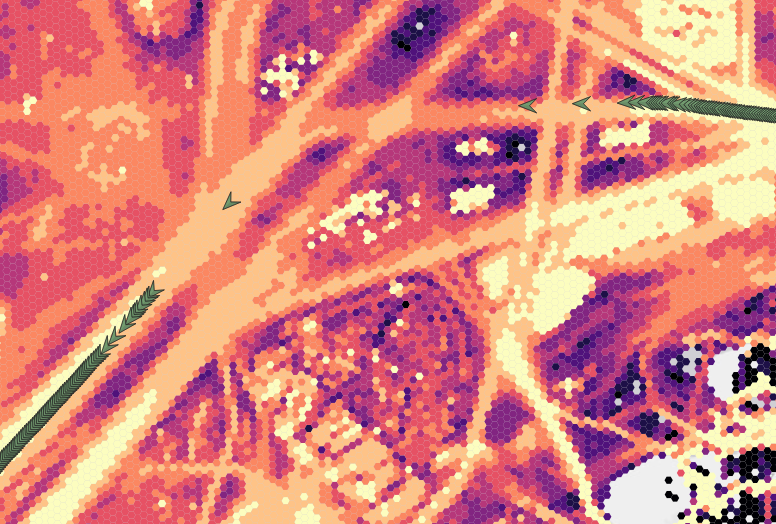
Building up vessel trajectory is pretty tough when you have an irregularly sampled, noisy dataset that can have gaps due to poor reception. Take a look at the received AIS messages for a single vessel that left Rotterdam port, went out into the open ocean (out of range of the coastal AIS stations that collected this data) and then pulled into Dunkirk. It is a nice combination of high resolution data, low resolution data and a nice big gap. Sticking a vessel density map underneath the gaps shows where the vessels was, and that drawing a straight line between the last two points would cut outside the shipping lane. Not technically correct!
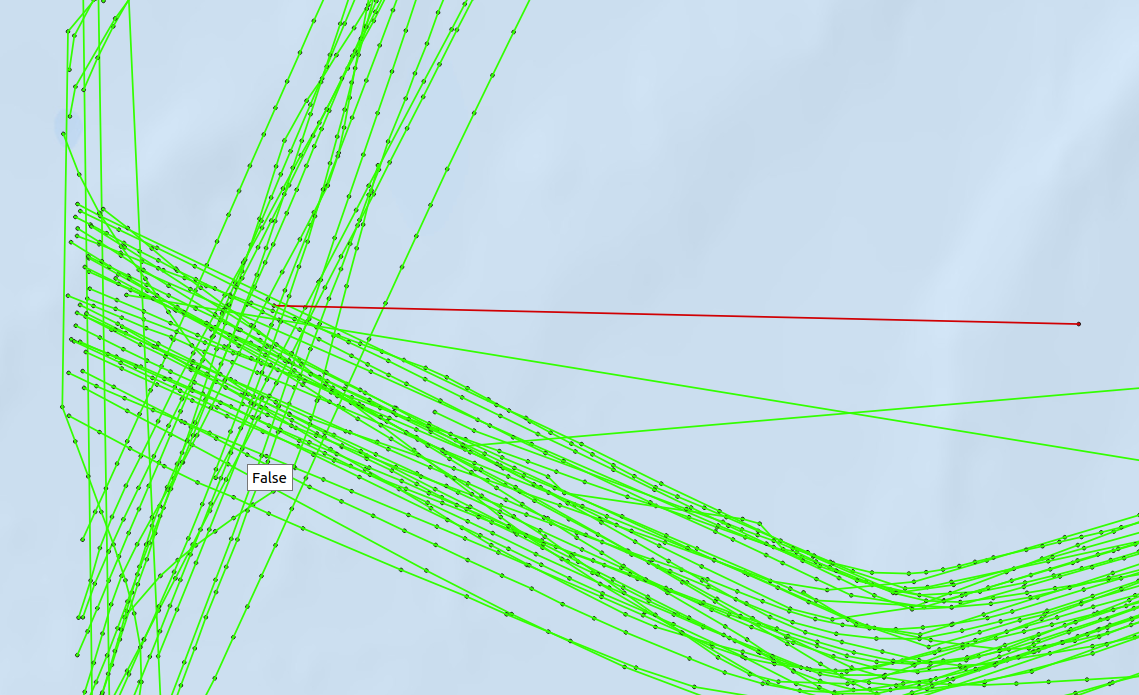
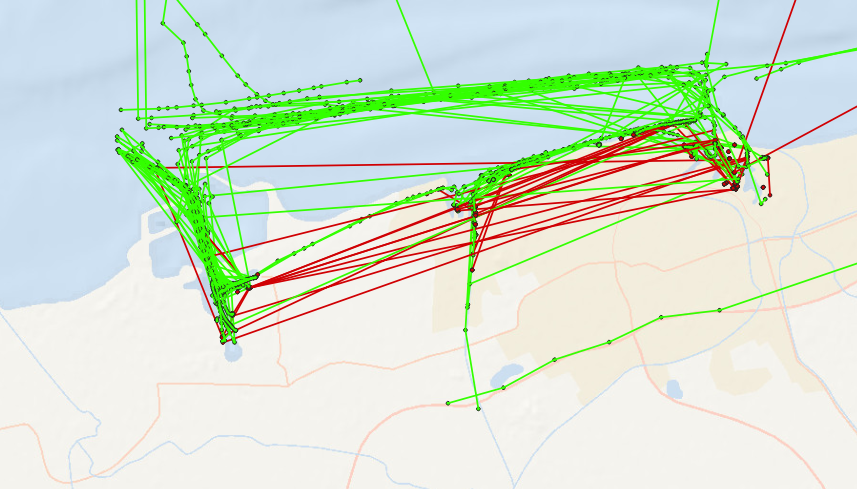
There is also the issue of errors in the reported vessel position, due to errors in the RF message received or GPS lock failure. These typically show up as large jumps in the longitude or latitude and often cross land. This kind of error could also occur when two vessels share the same ID and the two reported positions are interlaced:
So to build up meaningful trajectories vessel positions should be aggregated by vessel ID, ordered by time and grouped by:
- time period (daily, weekly, monthly)
- collections without large time gaps
- collections without large spatial jumps
- collections without large speed jumps
To do this would require several steps in PostGIS with some help from TimeScaleDB:
 WITH lead_lag AS (
         SELECT
            ais.mmsi,
            ais."position",
            ais.event_time,
            ais.sog,
            lag(ais.event_time) OVER (PARTITION BY ais.mmsi ORDER BY ais.event_time) <= (ais.event_time - '01:00:00'::interval) AS time_step,
            st_distance(ais."position", lag(ais."position") OVER (PARTITION BY ais.mmsi ORDER BY ais.event_time)) < 0::double precision OR st_distance(ais."position", lag(ais."position") OVER (PARTITION BY ais.mmsi ORDER BY ais.event_time)) > 0.1::double precision AS dist_step,
            (st_distancesphere(ais."position", lag(ais."position") OVER (PARTITION BY ais.mmsi ORDER BY ais.event_time)) / NULLIF(date_part('epoch'::text, ais.event_time - lag(ais.event_time) OVER (PARTITION BY ais.mmsi ORDER BY ais.event_time)), 0::double precision)) >= (2::numeric * (ais.sog + 0.5))::double precision AS sog_step,
            st_distance(ais."position", lag(ais."position") OVER (PARTITION BY ais.mmsi ORDER BY ais.event_time)) AS dist
           FROM ais.pos_reports ais
          WHERE ais.event_time >= date(now()) - interval '1 day' AND ais.event_time <= date(now())
        ), lead_lag_groups AS (
         SELECT
            lead_lag_1.mmsi,
            lead_lag_1."position",
            lead_lag_1.event_time,
            lead_lag_1.sog,
            lead_lag_1.time_step,
            lead_lag_1.dist_step,
            lead_lag_1.dist,
            lead_lag_1.sog_step,
            count(*) FILTER (WHERE lead_lag_1.time_step) OVER (PARTITION BY lead_lag_1.mmsi ORDER BY lead_lag_1.event_time) AS time_grp,
            count(*) FILTER (WHERE lead_lag_1.dist_step) OVER (PARTITION BY lead_lag_1.mmsi ORDER BY lead_lag_1.event_time) AS dist_grp,
            count(*) FILTER (WHERE lead_lag_1.sog_step) OVER (PARTITION BY lead_lag_1.mmsi ORDER BY lead_lag_1.event_time) AS sog_grp
           FROM lead_lag lead_lag_1
          WHERE lead_lag_1.dist > 0::double precision
        )
	  INSERT INTO ais.trajectories
 SELECT
		lead_lag.mmsi,
		lead_lag.time_grp,
		lead_lag.dist_grp,
		lead_lag.sog_grp,
		first(lead_lag.event_time, lead_lag.event_time) AS first_time,
		last(lead_lag.event_time, lead_lag.event_time) AS last_time,
		st_length(st_setsrid(st_makeline(lead_lag."position" ORDER BY lead_lag.event_time), 4326)) AS geom_length,
		st_setsrid(st_makeline(lead_lag."position" ORDER BY lead_lag.event_time), 4326) AS geom
	   FROM lead_lag_groups lead_lag
  GROUP BY lead_lag.mmsi, lead_lag.time_grp, lead_lag.dist_grp, lead_lag.sog_grp;
Now this SQL looks a little complex but each step is pretty simple. The first CTE fetches all AIS messages for yesterday, uses a window function to calculate the distance between each point (in order), and returns several “steps” that are triggered if two sequential position reports are too far apart in time, space or if the reported speed and calculated speed are too different.
st_distance(ais."position", lag(ais."position") OVER (PARTITION BY ais.mmsi ORDER BY ais.event_time)) < 0::double precision OR st_distance(ais."position", lag(ais."position") OVER (PARTITION BY ais.mmsi ORDER BY ais.event_time)) > 0.1::double precision AS dist_step
“dist_step”: this is True if the distance between two messages is 0 (a message was repeated), or if it is was greater than 0.1 degrees (about 10km).
(st_distancesphere(ais."position", lag(ais."position") OVER (PARTITION BY ais.mmsi ORDER BY ais.event_time)) / NULLIF(date_part('epoch'::text, ais.event_time - lag(ais.event_time) OVER (PARTITION BY ais.mmsi ORDER BY ais.event_time)), 0::double precision)) >= (2::numeric * (ais.sog + 0.5))::double precision AS sog_step
“sog_step”: this is True if the reported and calculated speed are too far apart. This happens when there are large jumps between points (possibly due to an GPS error) but is insensitive to large jumps that are due to gaps in the data while a vessel is moving.
lag(ais.event_time) OVER (PARTITION BY ais.mmsi ORDER BY ais.event_time) <= (ais.event_time - '01:00:00'::interval) AS time_step
“time_step”: This one is simple. It is positive if there is a gap > than an hour between messages.
The next CTE, lead_lag_groups, creates a running count on the different steps. The time_grp column, for example, would increment each time there was a gap greater than 1 hour in the AIS message sequence.
The final part of the query creates a line that is grouped by the vessel ID and the different lead_lag groups. Using this on the first example of the vessel gives:
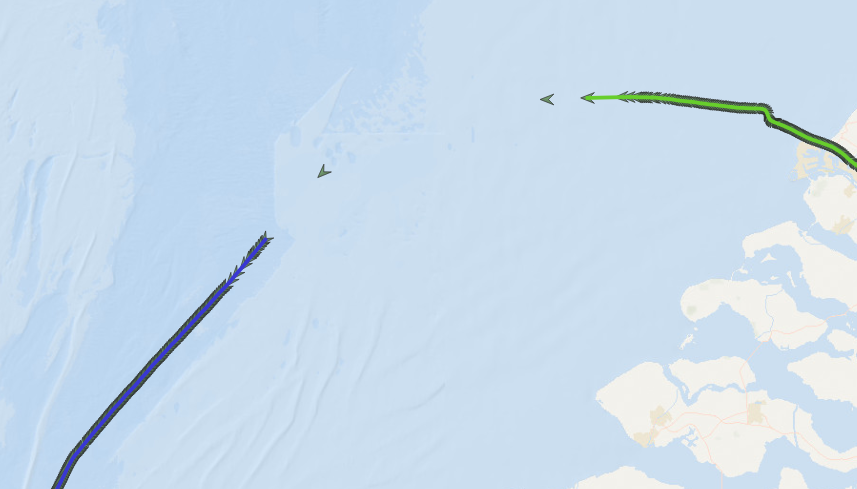
The middle couple of AIS points, where the vessel was almost out of range, are missing from the trajectory but that can be fixed by fiddling a little bit with the step parameters.
Now the above line isn’t actually a trajectory since the linestring is two dimensional. But I’m almost certain this can be easily fixed by using ST_Force3D function with the timestamp (in seconds). This is what’s running in production though and while I really should change it, it will take some time to reprocess all that data…