High Resolution Vessel Density on the fly
Let’s say you’re the kind of person who has access to an underwater acoustic sensor network. You might use this to listen for fish noises, or dolphin chatter but if you’ve only got access to the very busy North Sea you probably have hours and hours of ship noise recordings to go along with your more interesting biological data. There have been many news articles about the harm that underwater noise can cause to wildlife and there have been guidelines published on reducing it.
The first step in reducing anything is first measuring what it is. Underwater acoustic sensors are the end point of the noise chain (Ships make noise > noise propagates in the ocean > sensors and whales measure noise) but it might be useful to measure, or estimate, the variables in the other parts of the chain. Having multiple sensors and some good math would allow you to estimate propogation and to characterise noise coming from a single vessel. Networks are expensive, and have limited coverage; is there a way to build an estimator out of vessel traffic data, and some samples of acoustic data?
Here we go again… You could, if so inclined, get an estimate of vessel traffic in an area by aggregating the AIS data for that specific region and time. If you wanted, say, the cumulative number of seconds all vessels spent in a region you would need:
- a sensor location
- an area of interest that surrounds the sensor
- a time of interest
- a larger time and space window (so that no irregularly sampled data falls through the cracks)
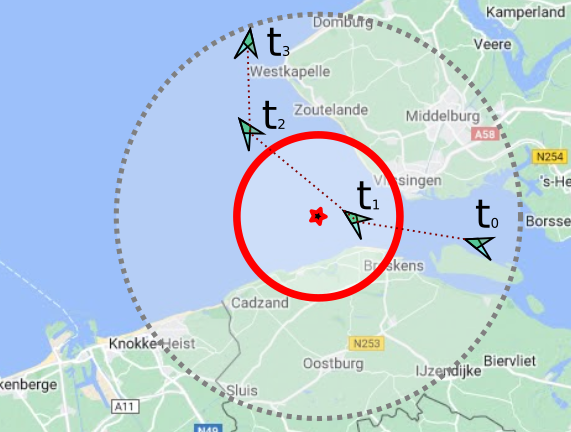
Where the sensor would be the red star, the area of interest is the red circle and the grey circle being a larger spatial window. In this example a single vessel entered the area, spent some time in it, and left to the north. Four AIS message were received during the time window examined, and of the 3 segments created from the four points only 2 intersected with the area of interest. The impact that a vessel \(x\)’s trajectory would have on the acoustic energy at the sensor,\(p_{sensor}\) ,can be modelled by the following equation:
$$ p_{sensor} = \int_{t=0} ^{n} {v_{x}(speed) . p(distance)} $$
where \(n_{x}\) is the noise generated by the vessel that experiences some propagation loss over distance; \(p(distance) \). The IMO link above states that the main cause of vessel noise is cavitation of the blade so it’s safe to assume the main input factor for \(n_{x}\) would be the speed of the vessel.
Now given that AIS data can be modelled as an irregularly sampled trajectory (and I don’t want to spend too much effort with calculus) we can estimate the acoustic energy at the sensor as:
$$ p_{sensor} \simeq \sum_{t=0}^{n} ({t_{n} - t_{n+1}) (\frac{l_n}{L_n})}. p(distance) $$ Where \(l_n\) is the portion of the segment, \(L_n\), within the AOI. For an initial first stab let’s also set \(p(distance) = 1\).
Now to get the various parts of that we’d need to do some work in PostGIS:
WITH aoi as
  (SELECT ST_SetSRID(ST_Buffer(ST_Point(3.49367,51.44540),0.1),4326) as geom)

SELECT
  event_time,
  mmsi,
  position
FROM ais.pos_reports, aoi
WHERE event_time > '2022-01-01'
AND event_time < '2022-01-01'::timestamp with time zone + interval '5 min'
AND ST_Within(position, aoi.geom)
The above will return a list of AIS position reports that fall within the AOI (a point with a 0.1 degree buffer around it). To get the time delta and the portion of the segment within the AOI you could use a window function:
WITH
-- Create Area of Interest from point and buffer
aoi as
  (SELECT ST_SetSRID(ST_Buffer(ST_Point(3.38986,51.47482),0.1),4326) as geom),
-- Find Vessels of Interest that are close to AOI
voi as
  (SELECT
    mmsi,
    date_part('epoch'::text, (lead(ais.event_time) OVER time_order - ais.event_time)) AS delta_secs,
    position as pos1,
    lead(ais."position") OVER time_order AS pos2
  FROM ais.pos_reports as ais, aoi
  WHERE event_time > '2022-01-01 10:00:00'
  AND event_time < '2022-01-01 10:00:00'::timestamp with time zone + interval '15 min'
  AND ST_Within(position, ST_Buffer(aoi.geom,0.2))
  WINDOW time_order AS (PARTITION BY ais.mmsi ORDER BY ais.event_time)
  )
-- Find segments where the start or end point are inside the AOI
SELECT
  mmsi,
  delta_secs,
  st_makeline(voi.pos1, voi.pos2) AS segment_geom,
  ST_AsText(st_makeline(voi.pos1, voi.pos2)) AS segment_WKT,
  st_distance(voi.pos1, voi.pos2) AS segment_length
FROM  voi, aoi
WHERE ST_Within(pos1, aoi.geom) OR ST_Within(pos2, aoi.geom)
AND delta_secs > 0
Plotting the returns in QGIS provides the following:
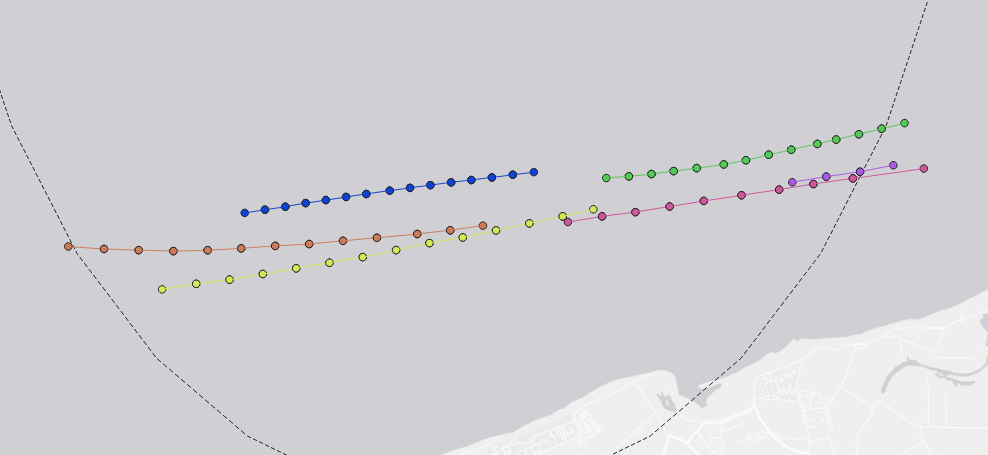 Where the dashed line is the Area of Interest (It’s a little distorted due to poor projection choices) and the vessel segments are coloured by MMSI and have a marker at the start and end of each segment.
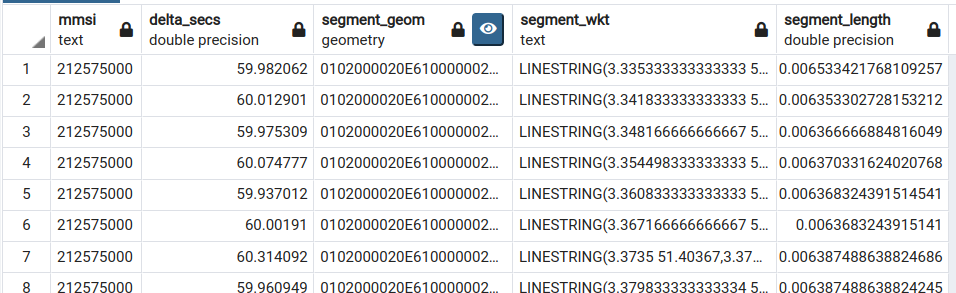
The data looks like:
Some work can be done to fix up the projection, pick more sensible buffer areas and rerun this for multiple buffer sizes in order to get a better estimate for \(p(distance) \).