Spatial Clustering
I thought that I should post about something I thought would be useful to people trying to get an AIS database off the ground. After looking at the work I was avoiding in my inbox I realised it would be more fun to talk about aggregates and clustering again!
So lets pretend you have your own spatial database filled with spatial point data. You might want to use all this information to try and spot regions that have some kind of connection to the point data. It might be a person’s home or work address (from looking at where there are groups of GPS points during work hours, or non-work hours) or popular cycling trails (derived from groups of GPS points on weekends). For ocean vessel traffic there is the obvious “shipping lane”:
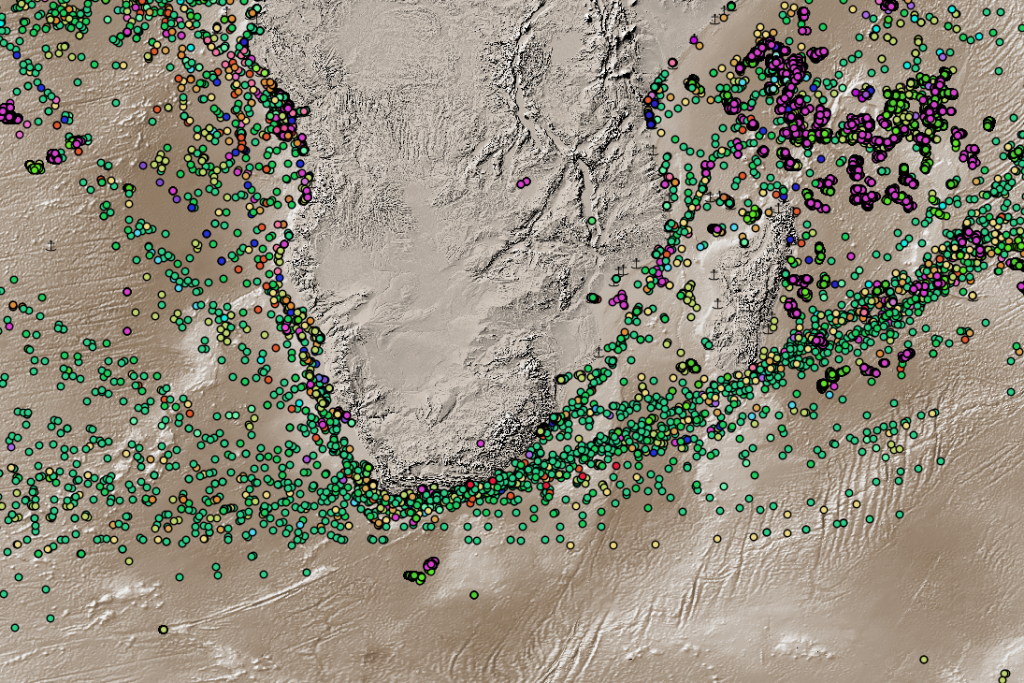
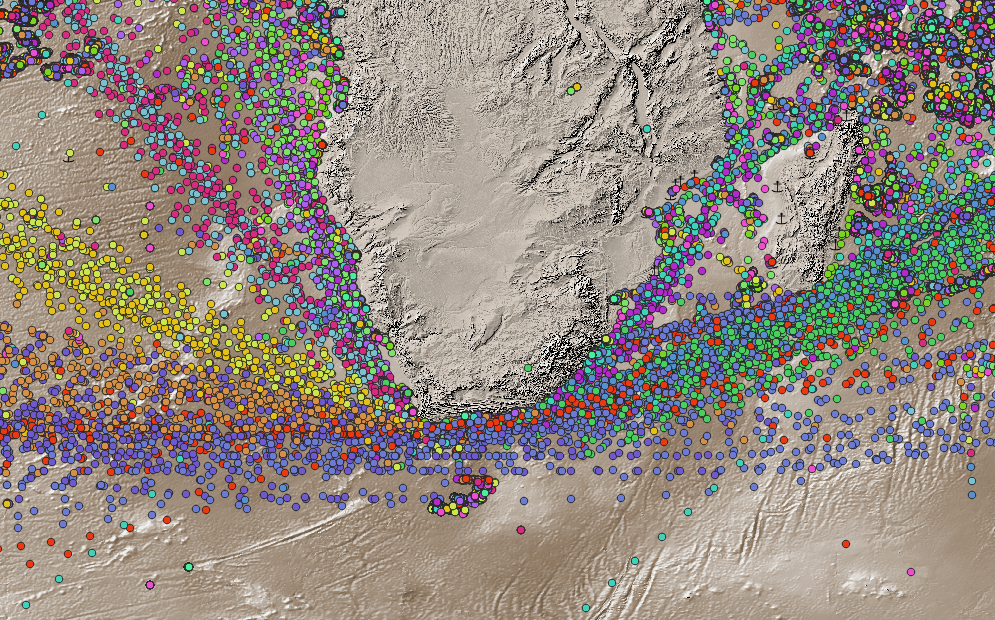
Positions of vessels at noon and midnight on 2020-01-01. Colour is reported AIS vessel class
Take a look at that image; you can immediately spot the shipping lanes coming from the America’s, around Southern Africa and heading off to the East. There is also a nice cluster of purple blobs in the top right of the image. The colours here represent AIS vessel classes with green being cargo and tanker vessels and that pretty purple being “Not Available”. Those “Not Available” classes also happen to be pretty close to clusters of “Fishing” and “Null” classes. Isn’t it great dealing with manually inputted data. A good first step might be to collapse the various vessel classes into a handle of more usable ones:
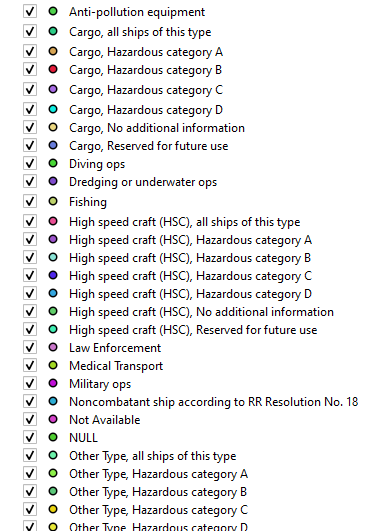
The first few AIS vessel classes and their corresponding colours on the previous image
So lets group all Cargo vessels (ignoring the Hazardous rating), tanker vessels and all the different kinds of nulls. Luckily the AIS protocol has these already grouped by the first character of their AIS class number. Ignore that Fishing vessels and Military-Ops would both start with a “3”. It can be handled later.
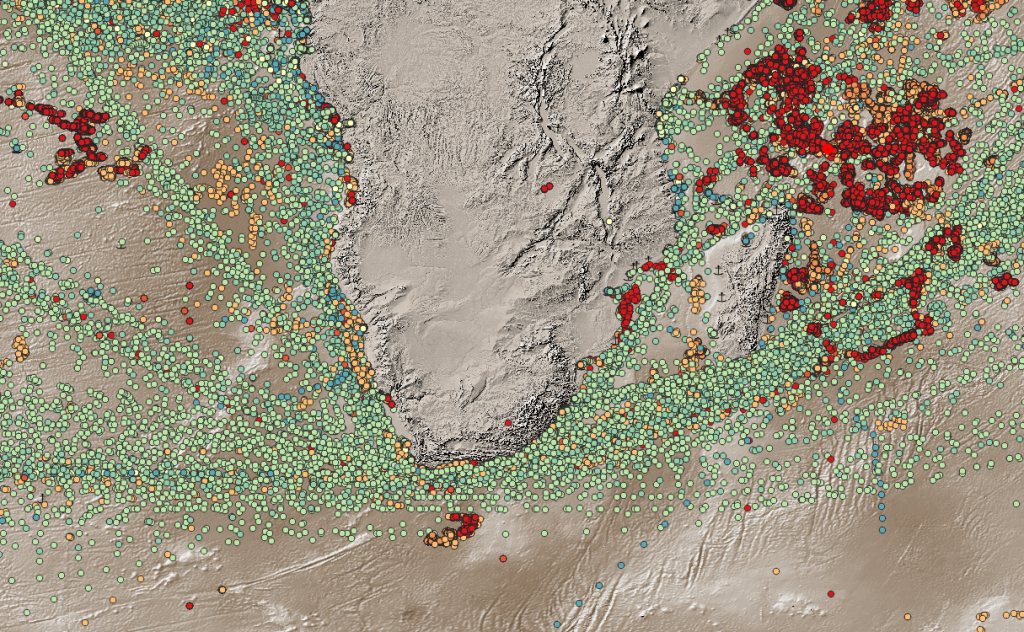
Same thing, this time with a week’s data and the collapsed classes
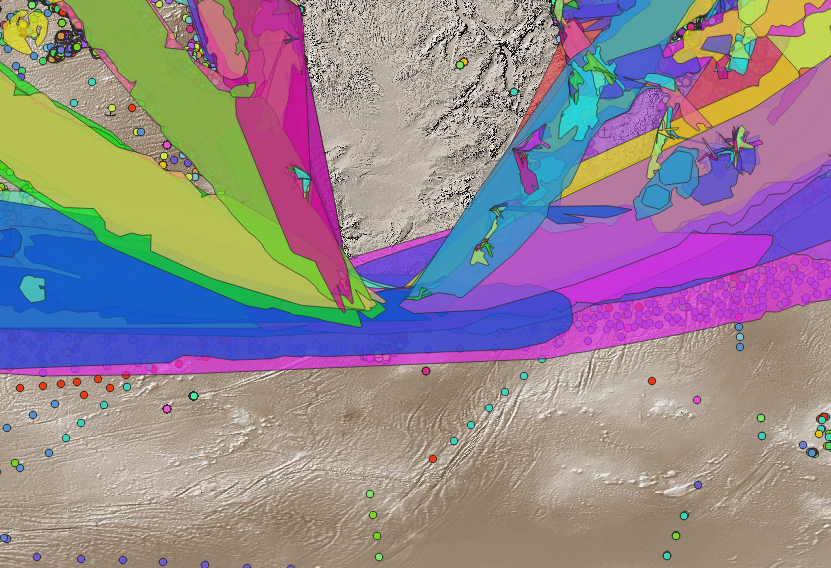
Looking better. The next step would be to draw blobs around the groups of points so that there is a simple polygon that would define a “shipping lane” or a “fishing area”. There’s one little problem… If I were to draw a blob around the shipping lanes it would look like this:
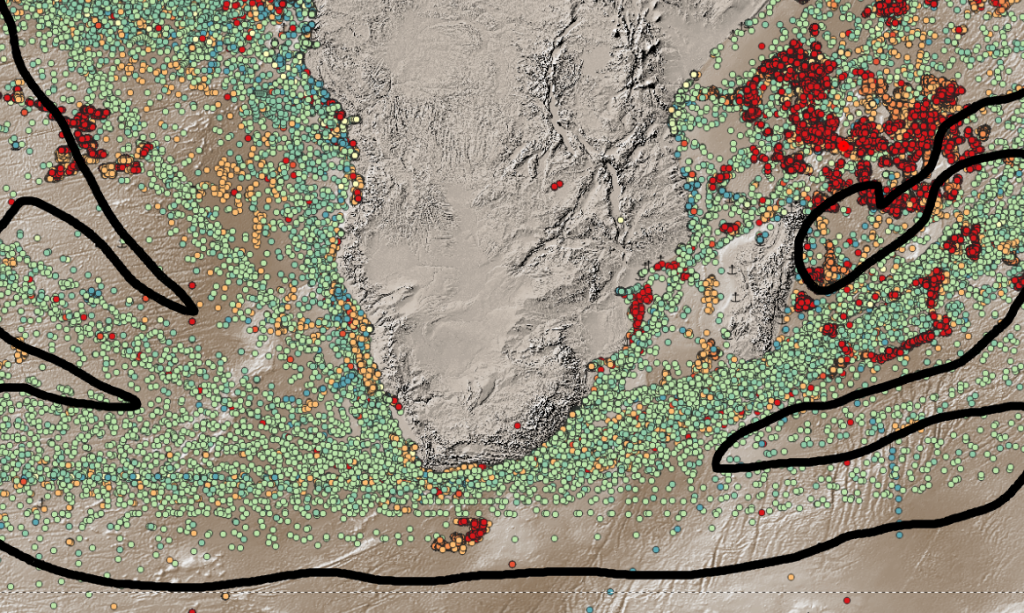
Not particularly useful
There needs to be another subclass… Another way to separate a shipping lane travelling North from one, say, travelling East. I mean, big ships usually travel in straight lines right? Why don’t we separate it by direction of travel… Postgres comes with a width_bucket function after all.
Points coloured by direction of travel split into 22.5 degree bins
That looks better. Immediately there is a seperate yellow/orange shipping lane from the pink/blue one. Each lane has two colours for each direction of travel in it. When clustering this will result in two overlapping polygons. You *could* play around with the modulus function to collapse these again but then you’d lose things like this:
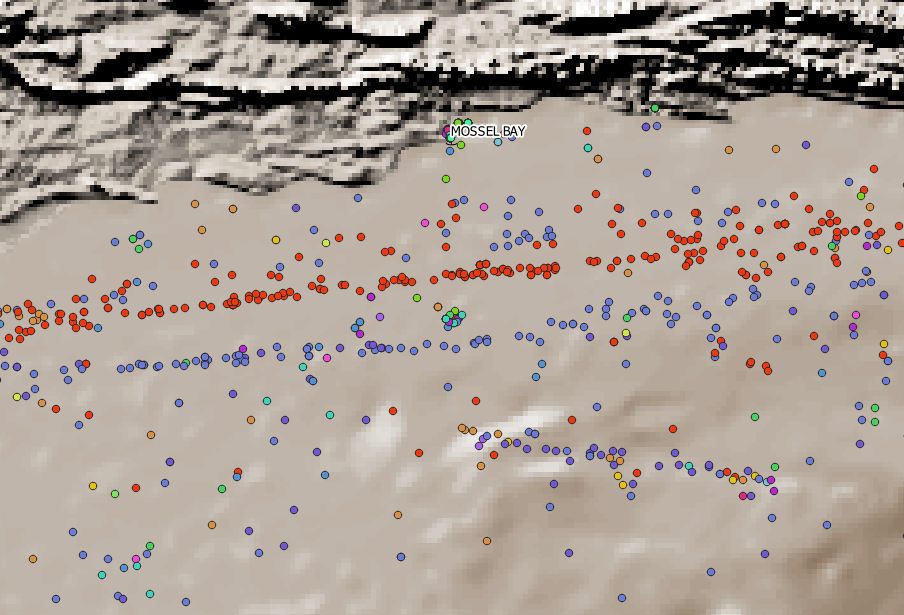
Around the gas platform near Mossel Bay there is an East and and a West lane.
So how to actually derive a polygon from these points. There is a “Density-based spatial clustering of applications with noise” algorithm in PostGIS. It’s pretty nifty. You still have to fiddle with the EPS (distance) and Minimum number of points in the cluster but you can just tell people you’re doing “hyper-parameter optimisation”.
Initial results in the following geom:
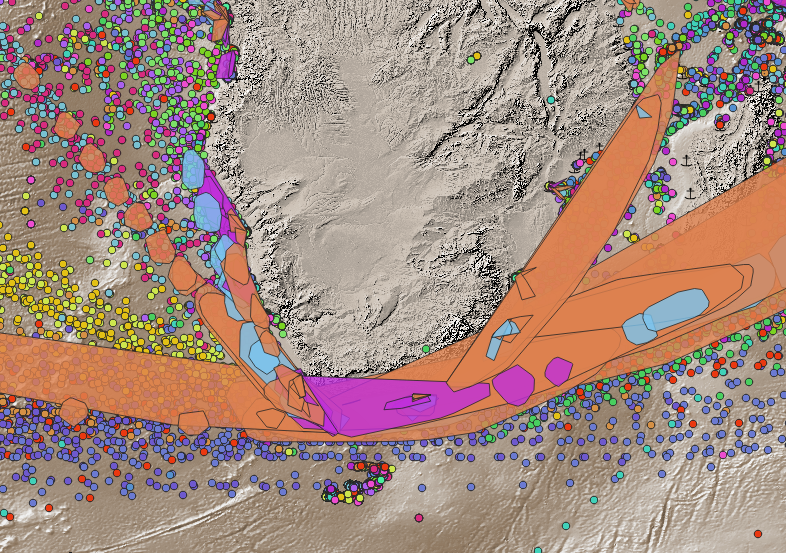
Bad DBSCAN parameters
The clustering parameters are bad. It’s missing out on some clusters because the density of the vessels isn’t enough. There some interesting artifacts in the Cape Town-to-NW route where the parameters are almost, but not quite, resulting in a single shipping lane. We could fiddle some more with the parameters or throw more data at the problem to increase the number of AIS messages in the region.
Overlapping fishing zone clusters in purple. Fishing vessels don’t respect my casual assumptions.
There are also multiple overlapping fishing vessel clusters. This is because our initial assumption of vessels traveling in straight lines in shipping lanes doesn’t apply to fishing zone. They just move around willy-nilly. I’ll just remove that condition from the fishing clusters.
There might be some kind of way of doing actual hyperparameter optimisation where a cost function could be written to minimise the number of clusters while also minimising the area of each cluster (to avoid having a single super cluster that covered the globe) but that sounds like hours of effort to avoid minutes of fiddling. I’m also grouping the points in a cluster into a single geom using Convex Hulls rather than Concave because it’s much quicker. For the final product I’ll use ST_ConcaveHull since the results are a little prettier. It also introduces another variable to fiddle with to optimise them hyper parameters, hoorah!
It could also be worth using linestrings, built from the points grouped per vessel, to build up the clusters. PostGIS functions happily work on multiple geometry types. I’m in too deep now for that.
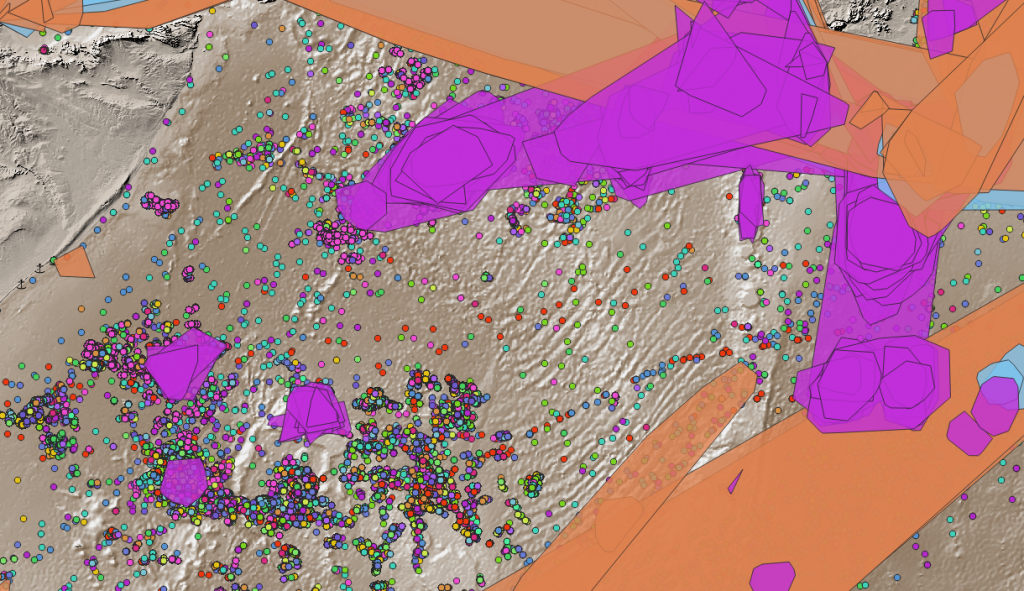
This is marginally more useful
That looks good. There are also some nice small port entrance and exit lanes for Richards Bay and Durban. You could also take this a step further by seperating the classes again by speed. Shipping lanes would be where:
- cargo/tanker vessels travel
- at speeds > 10 knots
- in a relatively stable course (so that whole COG binning thing)
OR you could do something a little fancier:
- Build trajectories for each vessel, grouped by vessel ID, ordered by time
- Split those trajectories when the vessel was within the port limits and travelling < 2 knots (essentially creating port-to-port voyages)
- Do the whole DBScan thing grouping by start+end ports and vessel classes (not worrying about the COG binning)
- Create bounding geom’s from the linestrings + DBScan cluster ID
- Name the geom’s based on the start/end ports.
Suddenly you can do a super fast spatial check on any AIS message to find out “Vessel X is in the CPT to RIO shipping lane”. Same sort of idea for finding fishing zones vs routes to fishing zones.
WITH dbscanned
AS
  (
         SELECT voy.type_and_cargo,
                LEFT(voy.type_and_cargo, 1) AS left_char,
                cog,
                width_bucket(cog, 0,359,16) AS cog_bucket,
                latitude,
                longitude,
                position AS geom,
                st_clusterdbscan(position, eps := 1.5, minpoints := 20) over (partition BY LEFT(voy.type_and_cargo, 1), width_bucket(cog, 0,359,16)) AS cid
         FROM   ais.daily_pos_cagg as pos
         JOIN   ais.ship_details_agg as voy
         ON     pos.mmsi = voy.mmsi
         WHERE  pos.day >= '2020-01-01 00:00:00+00'
         AND    pos.day <= '2020-03-01 00:00:00+00'),

shipping_lanes
AS
  ( SELECT
        cid,       st_astext(st_makevalid(st_concavehull(st_collect(geom),0.8 ))) AS    cluster_wkt,
        st_makevalid(st_concavehull(st_collect(geom),0.8 )) AS geom,
     ST_MakeValid(ST_Convexhull(ST_Collect(geom) )) as geom,
        cog_bucket,
        left_char
    FROM     dbscanned
    WHERE    cid IS NOT NULL
    AND      left_char IN ('7', '8')
           GROUP BY cid, left_char, cog_bucket),

  fishing_zones
AS
  (SELECT   cid,
            st_astext(st_makevalid(st_convexhull(st_collect(geom)))) AS cluster_wkt,
            st_makevalid(st_convexhull(st_collect(geom) )) AS geom,
            max(cog_bucket),
            max(left_char)
   FROM     dbscanned
   WHERE    cid IS NOT NULL
   AND      type_and_cargo = '31'
   GROUP BY cid, type_and_cargo )
SELECT *
FROM   shipping_lanes
UNION ALL
SELECT *
FROM   fishing_zones