Slightly more complex spatio-temporal aggregations
Building a little AIS heatmap is easy. It’s just one or two PostGIS functions chained over an indexed grid. The output for this is not particularly useful other than for illustrative purposes. If you wanted to build something that was worthwhile the first step would be to define what a potential user would say is “worthwhile”. (By the way, this builds on the previous post, I’d say check that out first but I’m not the boss of you)
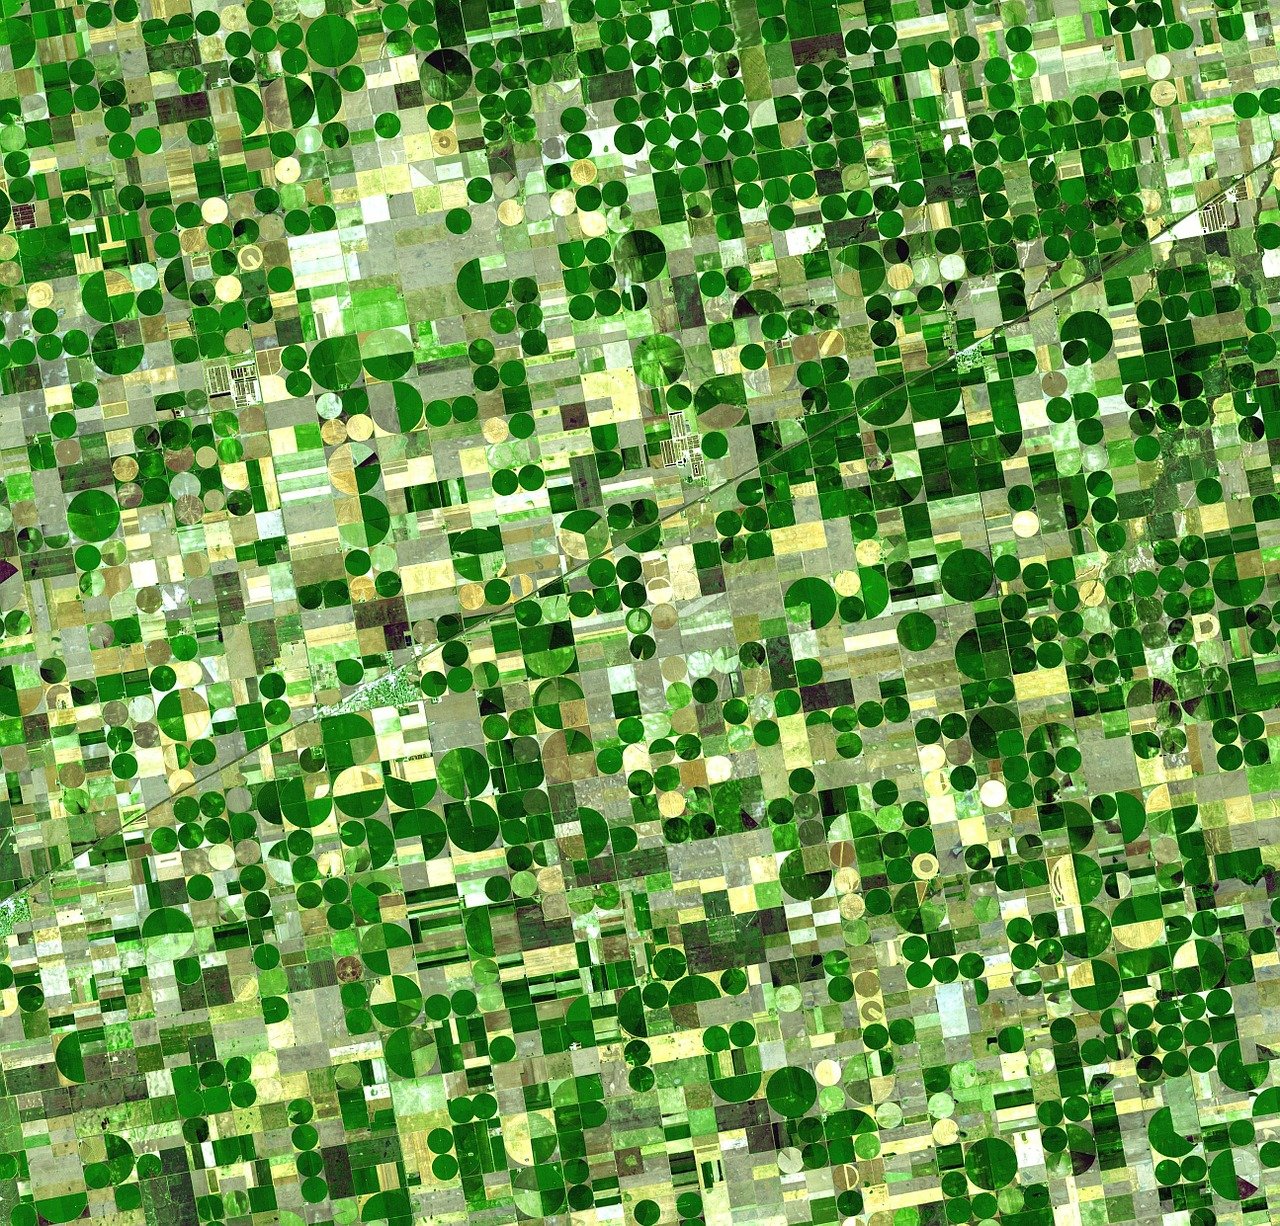
How much easier would it be if the world conformed to a nice grid…
Environmental enforcement users would be interested when a specific law or regulation is breached. Pollution monitoring users want long term trends for large vessels. Fishing regulators want to see catch effort and regions that might be overfished as well as keeping an eye on foreign flag fishing vessels. You can dig down deep into use cases for policing and customs, port authorities, smuggling, human rights violations, route optimisations, oceanography, marine biology and human interactions etc. Don’t forget some derived data like finding locations of gaps in the AIS record, wouldn’t it be interesting if a foreign flag fishing fleet had consistently bad AIS coverage near an EEZ border? AIS can be a pretty handy dataset for many domains.
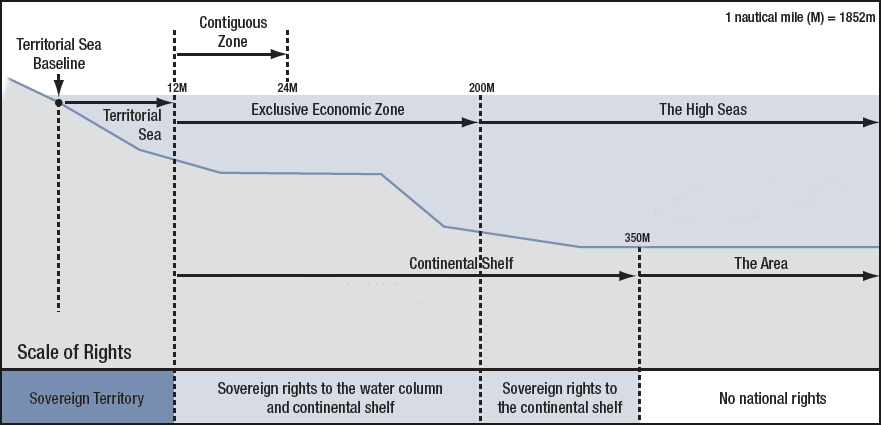
The legal boundaries of the ocean as defined by the UN
It would be fantastic if a single aggregation was useful for all these use cases. It would need to contain information separated by ship classes, date (for long term trends), country code (derived from MMSI or the radio callsign). It might be a little out of scope for “slightly more complex” but it would be interesting to aggregate over the speed and course (as a histogram), the time between messages and/or the vessels actual trajectory rather than just points. I think I’ll address those last ones in the next installment of aggregations.
Okay, so let’s group the previous query by:
- AIS vessel class
- Date
- Country code (as derived from the MMSI)
The AIS messages (at least the ones we’re interested in) come in two main flavours: position reports and voyage reports. The position reports contain information derived from GPS devices: position, speed, course etc. The voyage reports contain data that is generally inserted by the ship’s crew: vessel name and class, destination etc. Both message types are associated to a specific AIS transmitter or vessel by the Mobile Maritime Service Identity (MMSI) that comes with each message from a vessel.
To find the position of all fishing vessels would require a join of the position and voyage reports. This shouldn’t be too hard except for the fact that some MMSI’s are “reused”. Don’t ever try do anything meaningful with data from MMSI “0”. There is also a drift in data contained in the voyage reports, vessel’s get sold and their names changed, a pleasure craft one day might become a fishing vessel the next. It’s actually a bit of a mess but you can get “acceptable” result by taking some shortcuts here and there.
To get the country code of the vessel would require another JOIN on either the radio callsign (from the voyage report) or the first three numbers of the MMSI. Well, it’s the first three if it’s a vessel and get’s padded with 0’s if it’s a different kind of station… Let’s ignore those.
What the MID to Country table looks like in my DB
The date is also “easy”. There are several database functions to extract a date from just about any kind of time format. The one issue is that AIS data doesn’t come with a timestamp. It’s just not in the protocol. So it might be tucked away in the metadata you get from the dataprovider, or else you’ll have to stick in the reception time (which may not be the transmission time due to network delays or some other factor) and may or may not come with timezone information. Luckily the data I’m using has a reception time tagged onto it. Give or take a couple nano-seconds due to speed of light and the timestamp should be good enough.
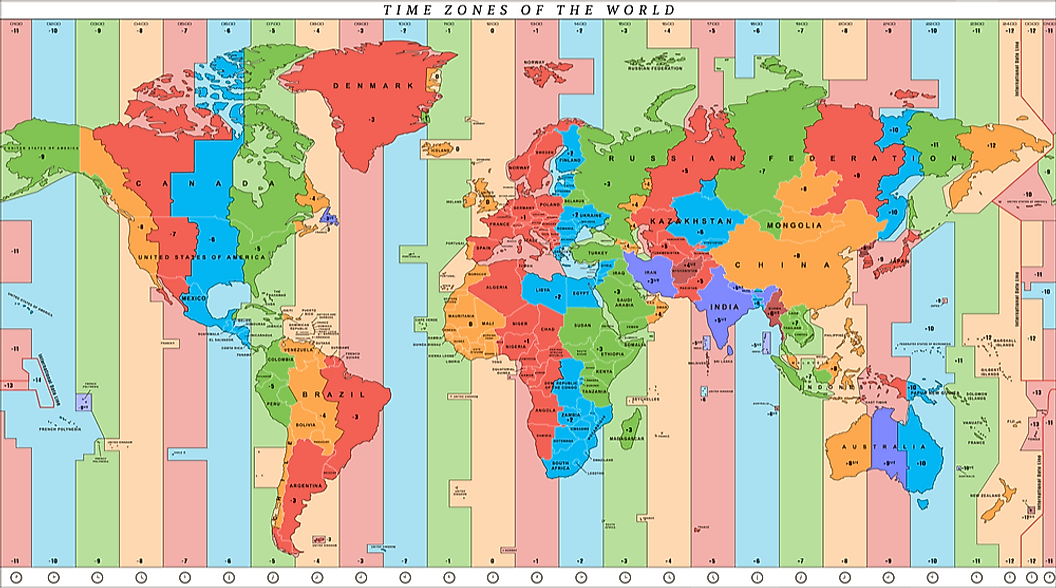
The only thing worse than dealing with timezones in data is not having them
Speed is probably the most reliable data to group by here. It’s derived from the GPS data and has a known “NULL” value. You’d be pretty safe throwing away any speeds above 30 knots since that’s lightning fast for ships. You *could* run this query a bunch of times limiting to a speed of interest (say between 2 and 5 knots for trawling activity) but you could just as well use or use a histogram function from TimeScaleDB. Let’s just pretend we did.
Okay, then using a bunch of prebuilt and indexed tables (I can’t go through everything here) to make things easier looks like (don’t worry about the country code now, I see I forgot to stick it in. I’ll add that to the next one):
CREATE MATERIALIZED VIEW med_agg AS (
SELECT
St_AsText(hex_grid.geom) AS wkt,
hex_grid.geom,
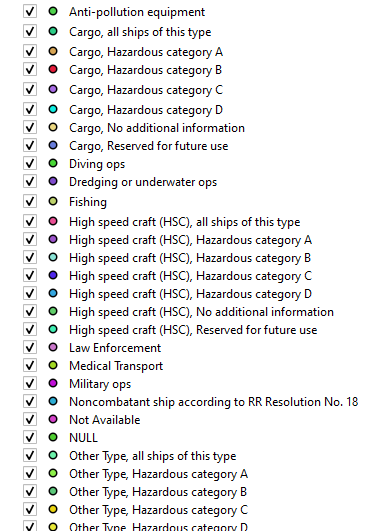
voy.type_and_cargo_text,
date(pos.event_time),
count(*)
FROM ais.daily_pos_cagg as pos
JOIN geo.hex_grid
ON ST_Within(pos.position, hex_grid.geom)
JOIN ais.ship_details_agg as voy
ON pos.mmsi = voy.mmsi
WHERE pos.day BETWEEN '2020-01-01' AND '2020-02-01'
GROUP BY hex_grid.geom, date(pos.event_time), voy.type_and_cargo_text
)
Now you’re essentially running the same query a bunch of times on different slices of data but Postgres is a champ at planning and figuring out this kind of data. It took under 6 seconds for a single day of data and 1m20 for a month. Now I’m not running this on the full AIS dataset, that would be huge amounts of data. Instead I’m running it on a LOCF every 12 hours sample.
With this you can do things like:
SELECT
	geom,
	sum(count) as count
FROM med_agg
GROUP BY geom
Which, when displayed in QGIS, becomes:
Remarkably similar as the previous post’s aggregate…
But you could also do this:
SELECT
	ST_AsText(geom) as wkt,
	geom,
	type_and_cargo_text,
	date,
	count
FROM med_agg
WHERE type_and_cargo_text = 'Fishing'
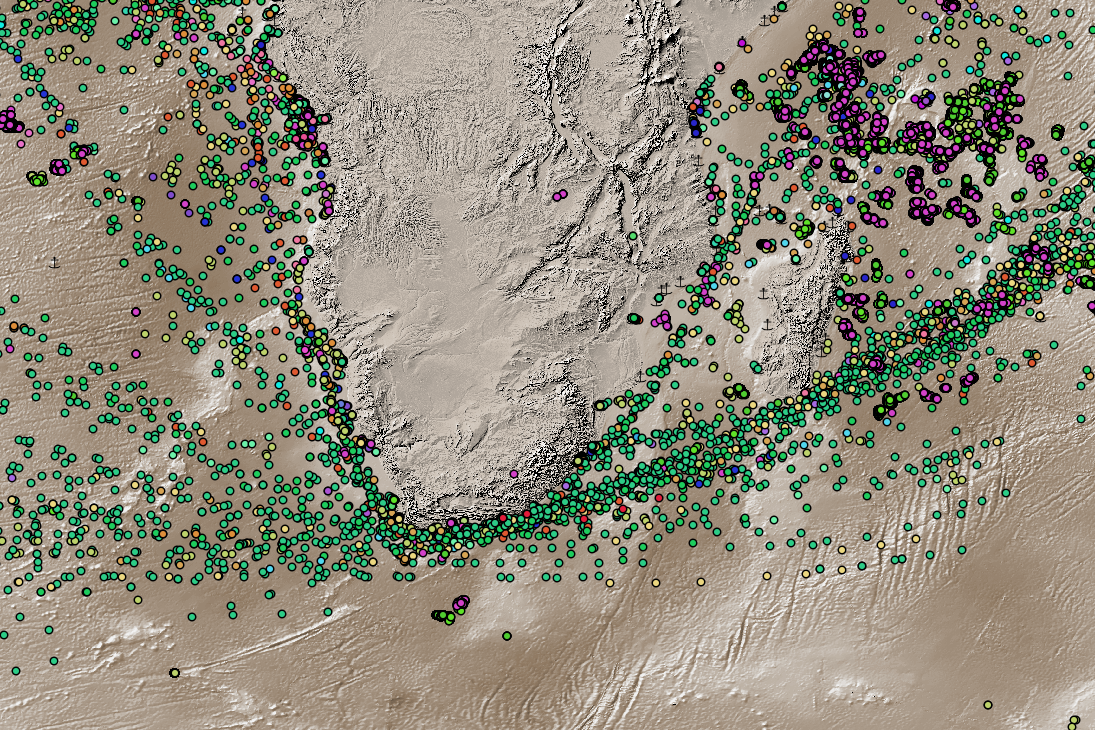
which with a bit of QGIS magic becomes:
There isn’t really enough data to make a “true” aggregation. This is more of a plot of single vessels (or vessel groups) moving around. Using the un-sampled AIS data, or using larger time spans would show some nicer heatmaps. But in general, you can tell that there is some movement between RSA and South America, as well as where some hotspots are.