Block Diagram
This is a quick description of a deployed OpenAIS system and how it would function. This page is mapped to this repository.
The below block diagram shows a deployed OpenAIS system:
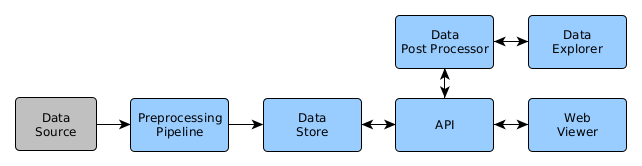
The data source can either be a local RF receiver, a file, or streaming data coming in from a server. There are several examples of AIS data sources that can be used as a starter for the OpenAIS system:
- AIS Files
- Streaming Data
- RF receiver
In general though, the raw data you receive is going to be encoded in a NMEA format and require some processing to turn it into something usable. It also may, or may not, include a timestamp with the data. The format of the timestamp will vary from source to source since there isn’t one in the raw AIS data.
The preprocessing step would include the following steps:
- Decode of AIS NMEA strings
- Attach a timestamp to the message (if required)
- Remove data that is not of interest
- Insert data into the datastore
The preprocessing steps are connected to each other using a pub-sub message broker that handles the queues and routing of messages between the steps. This allows new blocks to be quickly added into the stream, duplicating streams onto other machines and persisting of message queues should a preprocessing service fail for some reason.
Seeing as how the data we’re working with is a time-series with spatial components, it would make sense to use a tool that is focused on that kind of data. PostgreSQL is one of the most popular open source DBMS but it becomes even better once you combine it with a geospatial tool like PostGIS. Add the TimeScaleDB plugin to provide time-series functionality and you have a data store that can easily:
- Handle geospatial queries to compare vessel locations to points, legally defined ocean regions, dynamically generate regions, build up trajectories etc
- Automatically partition large tables into daily/weekly/monthly child tables, compress them when they get old and easily delete them if required
- Place data into sensible hourly/daily bins. This allows dense datasets to be quickly checked using less dense representation and to provide semi-regularly sampled datasets for machine learning
- Benefit from database tools to handle security, high-availability, backups/restore, user permissions etc
There needs to be a coherent method to pull data out of the datastore. If it is abstract and logical enough then developers can intuitively use it to create new products. If it used an OpenAPI standard then the development of a client library could be created by using some of the many OpenAPI generators out there.
This will be examined a little more in the Data Architecture section.
Some tools require specially preprocessed data that isn’t easily compatible with a REST API. The first one that comes to mind would be the high speed rending of large amounts of AIS data.
This could also be extended to automatically aggregate large volumes of data, create scheduled reports etc.
While I enjoy the elegance of the backend, when it comes to users interacting with data there isn’t anything better than a nice GUI. While these components are still under development the general feel for how this two are split are as follows:
Data Explorer:
- Used to examine large volumes of semi-anonymous data
- Discover long term spatial trends
- Examine how these trends change over time
- Discover human activity by examining the data coloured by Navigation Status or Vessel Class
Web Viewer:
- Search for specific ships or their tracks
- See what is happening in a region, for a narrow slice of time
- Look at the behaviour of a handful of ships
- Discover more detailed class or event information for these vessels
On of the pleasures of a micro service architecture is the ease with which you can add more services. They are micro after all, so they’re not particularly heavy…
These have been proposed, and there are some ideas on how to create them but there hasn’t been much set in stone yet.
If real time alerting or data processing is required then hooking up a service to the message broker is pretty easy. The reason for doing this could be:
- Alerting on critical situations: Fishing vessel inside MPA, Interruption on input data stream, Vessel out of control etc
- Machine learning on data streams: real time classification
- Improved filtering: A more involved filter that takes a vessels location, speed, last report etc is required…
- Trials on alternate services: maybe another decoder/filter/inserter requires testing…
One of the goals of this project would be to provide additional information from the huge amounts of AIS data available. One of the extra tid-bits that can be provided would be:
- Vessel Classification: Many vessels fail to provide an accurate vessel class description but their behaviour might provide some clues
- Behaviour Classification: Cargo ships go straight, fishing vessels fish, passenger vessels go hither-and-yon
- Anomaly Detection: A vessel in distress might not behave the same as one in normal operation
It would be nice to have a bunch of pretrained models, a place to store them, and an easy way to use them with the viewers. Luckily some work has been done on that.
How many question have been asked?
Not enough…